April 04, 2020

Texas Pacific Land Trust, King of Landlords


Overview
Texas Pacific Land trust (TPL from now) is one of the largest landowners in Texas. The Trust dates to 1888 and formed part of the land holdings of the old Texas & Pacific Railroad; TPL is now the second-oldest “stock” on NYSE.

TPL operates the business in two segments: Land and Resource Management and Water Services and Operations.

*Land and Resource Management
This segment encompasses the business of managing approximately 900,000 acres. The revenue streams of this segment principally consist of royalties from oil and gas, revenues from easements and commercial leases, and land and material sales.
Revenues is derived from the oil and gas royalty interests. Thus, in addition to being subject to fluctuations in response to the market prices for oil and gas, the oil and gas royalty revenues are also subject to decisions made by the owners and operators of the oil and gas wells to which the royalty interest relate as to investments in and production from those wells.
TPL owns “non-participating perpetual royalty interests” (NPRIs) in about 456,000 acres. NPRIs entitle TPL to a perpetual right to receive a fixed cost-free percentage of production revenue. TPL also charges users for easements – for pipelines, work crews, roadway rights, power lines, storage facilities, etc. Since its land covers such a large area, almost any infrastructure project will cross TPL land.

*Water Services and Operations
TPL also controls the water rights to these acres. As drilling is water intensive, this creates an opportunity for TPL to charge for access to its aquifers and for water recycling.

Horizon Kinetics, an investment adviser highly oriented in value investment philosophy, owns a quarter of the shares and is involved in a case against the trustees to convert TPL to a C corp. and improve disclosures and governance. Although this conversion takes several months, it seems to be going well.

The Advantages
TPL´s land lies in the western portion of the Permian Basin, known as the Delaware Trend. The Dept. of Energy not too long ago determined that the Delaware Trend contains the world´s largest oil and gas deposit outside of Saudi Arabia.


Until very recently, the capital spending plans of drillers like Chevron, Exxon, EOG, Shell and Occidental confirmed that they were planning to expand production for many years in the Permian Basin.

We must also bear in mind that US produces approximately 12-14% of global oil supply, and the lowest cost curve is in the Permian.

As I wrote before, the TPL royalties are perpetual, so any US energy collapse and oil price surge, would drive production right back to these acres at materially higher prices.

It is relevant that TPL has zero debt in its balance and that operating lease are not significant, we must keep in mind that debt in good times are good for equity investors, but very ugly in bad times.

Recent Events
All things about oil were in shape until the recent war between Russia and Saudi Arabi comes on the scene. The deal, that these two countries had, were broken, plunging oil wti prices to around $20 (lowest level in 18 years). TPL has 19 years of production that breaks even bellow $40, so $20 represented a must to close for most shale oil companies in the Permian Base. This extreme situation forced to USA intervene trying to find a truce that seems going well and oil prices are being recovered.

A Short Story
TPL is highly profitable (ROC +200%) and, with zero debt, the company has a great advantage in the recession that we face.

Since 2010, TPL has passed from $20 m up to $490 m in revenues, growing at 43% CAGR, and its EBIT has multiplied by more than 20.

In the next picture we can observe in bars revenues and EBIT in last 10 years, and how well correlated are with “Texas Oil Production (mb/day)”
The secret to its success is not hard to find: the company has no competition as the land (at the heart of Permian Base) is theirs, period.
The chart above reflects something not so obvious: TPL is not so strong correlated with oil prices as we would expect at least in the long run. Therefore, one could suspect that value creation occurring at TPL does not depend so much on oil prices except some probable short-term noise which I don´t deny that there can be.

Analyzing the Texas Oil Production Data
The aim of this post is to value the company according cash flows the company could generate in the future.

I will employ a two-stage valuation model, where we project revenues for the next five years and then lower the growth rate to the Treasury bond rate of 0.61% after that.

The reason to choose a first stage of five years is that our power to predict revenues is limited by our historical data.

Before we try to project revenues for the next 5 years, I will analyze the time series data (of Texas Oil Production) through 2014, using those data to forecast the Oil Production through 2019 that we would have expected if there had been no unusual event, and then compare the predicted Oil Production with the actual 2014-2019 data.

The first step in time series analysis should always be to view the data:


Before we fit a time series model, I will remove the seasonality and trend in our data.

Our first step is to construct a table for average seasonal and trend factors to account seasonality and trend from our data. Then we need to remove both seasonality and trend for the pre-2014 time period, the result is shown following:

With our Deseasonalized and detrended data, and armed with a software for statistical tools (Crystal Ball, ModelRisk, etc), it is possible to fit a time series model to remaining variability in the time series and forecast the post-2014 oil production. The best Time Series Model I found was a variation of a “Geometric Brownian Motion (GBM) model”, sometimes referred to as “random walk model”.
How good is our time series model is measured with the Thiel´s U, a statistic that can provide such a measure. The closer Thiel´s U is to zero, the better the forecast is.

To implement Thiel´s U in our oil production model, I calculate it simulating in the software of statistical tools. My results are the following:


Figure above shows a mean Thiel´s U of 0.10 which I consider as a moderately good measure.

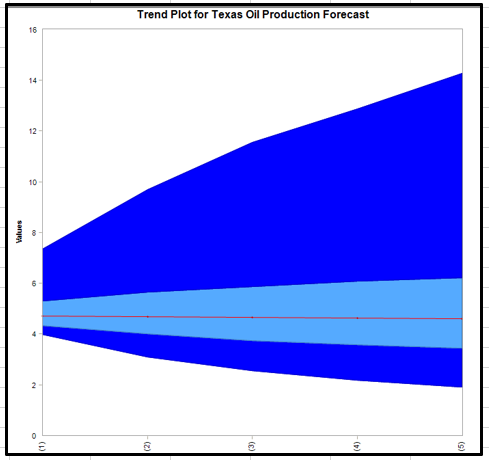
And now, we are ready to forecast the next 5 years bellow:

The trend chart, suggest that de median oil production is expected to be the same over the next 5 years. One year into the future, the range of production is fairly narrow, but the time a year passes, the forecast range extends from 2 mb/day to over an extreme 14 mb/day.

I will assume average value of distributions of oil production for each year as my base case:

Projection of revenues for the next five years
In order to project revenues into the future, I need to regress past revenues against a variable that best fit my regression. Some candidates could be “WTI oil prices ($/barrel)”, “gas oil prices” or “Texas oil production (mb/day)”, or a combination of these variables.

I have tried several combinations, but the best one is to focus on “Texas oil production”. Now you, reader, can understand my effort in point 5 of this post.

If I run a regression revenues against oil production (according our limited data from last 10 years), we have an R-square high (75%) and an oil production coefficient highly statistically significant (P-value = 0.001).

If I wish to forecast the revenues that would result from whatever amount of oil production, we could use the estimated relationship
Revenues ($ m) = -144.32 + 83.52 x Oil Production (mb/day)

But because of the limited amount of data and because of chance, there is uncertainty about the true relationship between oil production and revenues, and to simulate the uncertainty in the relationship correctly, we need to adopt a different procedure.

The method I will use is a parametric Bootstrap. This procedure outputs bootstrap samples which are constructed by simulating the sales level for each Oil Production level in the original data set.
Finally, with my Bootstrap model, I get Revenues for the next five years which are normal distributed as follows:

In the figure above we observe that the further we move away from the present, the wider our distributions and less accurate our predictions, of course.

Again, I will assume average value of distributions as my base case:

Final Valuation
Now, we are ready to value our company. In the next table I try to summarize my valuation


I was tempted to give some probability to fail due to the next recession we face, but my probability is zero because TPL has no competitor right now. My equity value is $2.439 billion, there are 7.76 million shares outstanding, and my final valuation is $353.02 per share.

The great deal of uncertainty in this valuation are revenues for the next five years which are driven by the oil production, but I can still estimate value in spite of that uncertainty. In fact, that is what I have done in the simulation below:


In terms of base numbers, the simulation does not change my view of TPL. My median value is $289.69, with the tenth percentile at close to $147.81 and the ninetieth percentile at $576.11, making it over valued, if it is priced at $457.00. The long tail on positive end of the distribution implies that I would buy TPL with a smaller margin of safety, because of the potential of significant upside.


November 22, 2019

Echostar, climbing high mountains


Note 1: If you don´t know anything about communication satellites, I would recommend to read this link communication-satellites-101 before you go ahead.
Overview
With a fleet of 9 Ku-FSS, Ka-FSS and S-MSS, EchoStar (SATS) provides video distribution, data communications, and backhaul services to meet the needs of media and broadcast organizations, enterprise customers, and US government service providers.

Headquartered in Englewood, Colo., and conducting business around the globe, EchoStar operates two business segments: Hughes Network Systems and EchoStar Satellite Services (ESS).
According to the last Q3 of 2019, dated at Sep 30th, EchoStar had $1,841.1m of revenues, $-1.6m of EBIT and total assets for $7,037.8m.
As of Nov 21th, 2019, EchoStar´s market capitalization was $3.9B with 97.4 million shares outstanding at a value of $40.68 each.
History
EchoStar was founded in 1980 by Charles Ergen with $500k in savings, as a distributor of C band TV systems.
In 1995, the firm launched its first satellite, EchoStar I. In 1996, it established the DISH Network business to market its home satellite TV system.
In 2008 DISH Network was spun-off, so EchoStar and DISH Network operate as separate public companies. However, a substantial majority of the voting power of the shares of both companies is owned beneficially by Charles Ergen.
As of Nov 21th, 2019, DISH Network and EchoStar, had a market capitalization of $20B and Charlie has a net worth of ~$10B
Business Segments
EchoStar has two important businesses, adding a third “Corporate&Other” not classified in the other two.
1.Hughes Segment
Hughes is the global leader in satellite broadband for home and office, delivering solutions and a comprehensive suite of managed services for enterprises and governments worldwide. Two kinds of customers, two businesses within Hughes, ie: Consumer and Enterprise.
Hughes is supported by a fleet of 5 Ka-band satellites: Jupiter1, Jupiter2, Eutelsat 65, Telesat T19V and SPACEWAY 3.
2.EchoStar Satellite Service

ESS consists of 2 Ku/Ka satellites which provide video distribution, data communications and backhaul services to meet the needs of media and broadcast organizations, enterprise customers and government service providers.

Hughes Segment Business and Jupiter Satellites
This segment is supported by two fundamental satellites: Jupiter1 and Jupiter2. What are Jupiter Satellites? and what can we expect from them?
Over the past several years, a technology shift has occurred within the satellite industry; as an example: Ka-Band EchoStar XIX/Jupiter2, launched in 2016, offer 200x capacity compared to legacy Ku-Band satellites, with in-orbit cost per Gigabyte per Second (Gbps) only a fraction of older satellites and confirming Moore´s Law.
The number of satellites that can offer this sort of service is also limited by the number of orbital slots available and the IP is very hard to recreate. In fact, only two companies fit: EchoStar and Viasat (VSAT), leaving us with a duopoly market.
Hughes Consumer Business
Consumer Business sells broadband service to consumers in very rural/underserved areas.
In the last years, Hughes Satellites has increased its capacity (Gbps) and the Hughes Consumer Business has increased its number of subscribers, going from 626,000 subscribers and 10Gbps in 2011 to 1,437,000 subscribers and 370Gbps in 30Sep2019. In the next table you can see this significance evolution.

The cost to build out infrastructure to underserved households in US is very expensive for cable, DSL or fiber companies. The Federal Communications Commission (FCC) estimated the cost to deliver broadband to the 10-20m households in extremely remote areas at approximately $8-10k per home. A cable company receiving $65/month in broadband revenue ($780/year) on a average life of four years for a customer and a 18% EBIT margin, spending $8-10k to receive a total present value of $8,229k in cash flows over the life of a subscriber, do not seems a good business.
On the other hand, if EchoStar spends $450m to build a satellite that can service 1m susbcribers who are willing to pay for higher speeds (25mbps) vs dial-up/DSL (1-5mbps), their cost to build out to a home is about $500 (including some cost of the modem at the customer´s home), constituting favorable economics.
EchoStar and competitors Viasat´s combined 4 satellites can serve 4m customers while the Federal Communications Commission (FCC) estimates that market size is about 20m unserved/underserved households in the US alone.

Finally, two more potential areas that will be satisfied by Ka-Band Jupiter Satellites are: 5G Wireless and Inflight Broadband Speeds.
5G Wireless is an ultrafast wireless standard that requires a densified network – ie more wireless towers along with small cell wireless towers attached to lampposts and in buildings. 5G is also all about backhaul –when we densify wireless networks with so many more radios, we need to “trunk” that data back through to the data centers. Trunking is accomplished through fiber/cable in large cities and satellite in rural areas. Given their cost per bit advantage in Ka-Band, we could envision an entire fleet of Echostar satellites across the world trunking capacity in rural areas.
In-flight broadband speeds using Ka-Band are much faster than substitute products that use Ku-Band. This is a large and growing market as new satellites are built across regions with aircraft traffic.
What can I expect from this business in the next years? We can start by the last data of susbcribers reported which is 1.437 millions, and I have estimated an average annual revenue per user $780, this give me a revenue of $1,121 millions in Hughes Consumer Business.
I will assume an expected growth equal the current expected inflation of 1.54% (nominal interest rate minus TIPS) for revenues per subscriber. Moreover, I will expect 2.735 millions subscribers around year 3 according capacity of satellites, and stay at this level forever.


I should advise that I have not consider any other satellite in the next years, but this is wrong as Echostar plans to launch Jupiter3 in 2020 adding more capacity and revenues.

Hughes Enterprise Business
Echostar provides of managed network services for large blue chip and medium/small enterprises across a range of industries (Lottery, Retail, Hospitallity, Restaurant, Finance/banking, Oil&gas, Airbone broadband, etc).
Enterprise Business offer connectivity to business in remote areas (ie all Getty stations outside cable/DSL footprint for transaction connectivity) utilizing Hughes´s aforementioned satellite constellations. Similar to the Consumer Business, with customers in rural areas, this business has little completion and 99% customer renewal.
In addition, the Enterprise Business supplies of satellite ground infrastructure and terminals to operators (Telefonica, Vodacom, IntelSat, EutelSat, GlobalStar, YahSat, BSNL, SES, OneWeb, etc).
Same question again as consumer business: what future for enterprise business? We know that Total Hughes Revenues has been $1,806 millions and resting the amount of $1,121 millions of Hughes Consumer Revenues, give us $685 millions for Hughes Enterprise Revenues. 


I will be very conservative with the future of these revenues and I will assume a growth in perpetuity of 1.69% (Risk Free Rate in usd = 10Yr bond usd).

Valuing Operating Assets of Hughes Business
Following in the next table I summarize a probable future for the Hughes Segment and operating income in the next 10 yrs.
I have estimated a current EBIT of $88.15 millions (previously adjusted to R&D expenses and operating leses, and after allocated corporate expenses) giving a margin of 4.88%, which I will scale up to the global industry average of 14.96% plus a 5% premium (19.96%) in year 5 and stay forever at that level assuming Echostar will share the duopoly with Viasat thanks to its economy of scale.
Tax rate will scale up to the Marginal Tax Rate in year 10.
I will assume a high capital investment model with low S/C Ratio. Although current S/C ratio is 0.49, I will assume that the company will improve progressively up to the global industry average of 0.99 in year 10.
The company had $797 in NOLs at 30dic18, and that amount must be taken in account in valuation.
Current cost of capital is 9.32%, and will move towards the global industry average of 6.38% in year 10.
Finally I obtain a value operating assets about $4,589 millions.
The European Spectrum Business, two probable scenarios
Echostar acquired Solaris in 2013 for $21.8 millions.
Solaris is a satellite company with 30MHZ of S-band spectrum in Europe and a satellite orbital slot. Echostar could lease the spectrum to wireless carrier and sell satellite service (machine to machine for logistics management, satellite radio service.. etc).
Users of smartphones are consuming more bandwidth each year, straining the medium by which the bandwidth is transmitted, spectrum. As wireless operators scramble to offer higher speeds to consumers, the value of spectrum will continue to increase.
Echostar is in discussions with regulators across the EU to repurpose this spectrum for terrestrial use.
Thus, it is probable one of these scenarios:
Scenario1
Let´s suppose that Echostar receive full approval from all EU regulators to run a Wholesale LTE Network.
I will consider this scenario as an option to expand an investment in new markets, to take advantage of favorable conditions.
Above I detail the inputs to estimate the value of the option ($1,599 millions) using a Black-Schole model.
Scenario2
If Echostar does not receive full approval from all EU regulator, the company could launch some combination of a satellite radio network with a wireless network.

Using the same method as the Scenario1, I value the option in $913 millions.
Investment in Dish Mexico
Echostar owns 49% of Dish Mexico, an entity that provides direct-to-home satellite services in Mexico. While financials are undisclosed, Dish Mexico has grown its subscriber base at 40%+/year and is estimated to have about 5m subs, currently.
While DBS providers in the US and in other developed nations trade at about $400-600/ subscriber, ARPUs are about 50% lower in Mexico, thus we value the investment in Dish Mexico at $613 millions.

Tying the pieces that I understand
Probably there are more hidden value in Echostar, for example: what about other minority investments, or what future could we expect in the ESS segment,.. there are other examples, but my capacity to discover other value is limited and I have decided to concentrate my efforts in what I know: Hughes Segment with subscribers in consumer front, Hughes Segment in enterprise front, the investment in Dish Mexico and the two options/scenarios of the spectrum in Europe.

Attaching all these three values, I finally arrive at $69.80 value/share for scenario.1 and $62.77 value/share for a worst scenario.2


September 26, 2019

Communication Satellites 101


What are Electromagnetic Waves?

Mechanical waves and electromagnetic waves are two important ways that energy is transported in the world around us.
Waves in water and sound waves in air are two examples of mechanical waves. These mechanical waves travel through a medium by causing the molecules to bump into each other, like falling dominoes transferring energy from one to the next.
Electromagnetic waves differ from mechanical waves in that they do not require a medium to propagate. This means that they can travel not only through air and solid materials, but also through the vacuum of space.
Electromagnetic waves have crests and troughs similar to those of ocean waves. The distance between crests is the wavelength. The shortest wavelengths are just fractions of the size of an atom, while the longest wavelengths scientists currently study can be larger than the diameter of our planet!
The number of crests that pass a given point within one second is described as the frequency of the wave. One wave—or cycle—per second is called a Hertz (Hz). A wave with two cycles that pass a point in one second has a frequency of 2 Hz.
An electromagnetic wave can also be described in terms of its energy—in units of measure called electron volts (eV). An electron volt is the amount of kinetic energy needed to move an electron through one volt potential. Moving along the spectrum from long to short wavelengths, energy increases as the wavelength shortens.
Consider a jump rope with its ends being pulled up and down. More energy is needed to make the rope have more waves.
Depending on which range of frequencies Electromagnetic Waves are moving, there are several types: Radio, Microwaves, Infrared, Visible Light, Ultraviolet, X-ray and Gamma Ray.
What is a Communication Satellite?


A communication satellite is a device used to receive, amplifies and transmit radio & micro waves in space. The satellite has communications equipment including receive and transmit antennas, power, and electronic components which enable to receive a radio signal from a terminal, and then transmit that same radio signal to another terminal.


The radio waves used for telecommunications links travel by “line of sight” and so are obstructed by the curve of the Earth. The purpose of satellites is to relay the signal around the curve of the Earth allowing communication between widely separated geographical points.

There are many functions and services which satellites are designed and used for: telephone communications, internet, video and TV distribution, etc

A vast array of satellites exist with various Frequencies (C Band, Ku Band, L Band, etc), Altitudes (LEO, MEO, GEO) and Orbital Planes (Equatorial, Circular, Inclined, Polar, etc)
Frequencies Used for Satellite Communications

Life of a Staellite
The design life of geostationary satellites is approximatly 10-15 years.
Orbital Location and Footprint
The location of a satellite is referred to its orbital position. All Geostationary Satellites are located in a single ring above the equator. The requirement to space these satellites apart means that there are a limited number “slots” available, thus only limited number of satellites can be placed in geostationary orbit.
The location of a satellite is normally measured in terms of longitudinal degrees East or West from the prime Meridian of 0 degrees.

The area of Earth’s surface for coverage of transmit to or receive from is called the footprint which can be tailored for different frequencies and power levels.
Uplink and Downlink
Signals transmitted from Earth to Satellite are referred to as uplink signals, and signals received from the Satellite are downlink signals.
The satellite, through the transponder, converts the signal before it retransmits back to earth.
The signals going up to the satellite are at one frequency range (band of frequencies) and the satellite changes them to a different frequency range coming down so they won´t interfere with the signals going up.
As an example: “C Band” uplinks at 6 GHz and downlinks at 4 GHz and “Ku Band” uplinks at 14 GHz and downlinks at 12 GHz.
Throughput rates (Mbps) say us how much data actually is sent/received to/from a Satellite. Of course, throughput rates depends on “Uplink/Downlink” signals and the frequencies assigned.
Satellites and Orbits
Geosynchronous Orbit (GEO) are located 35,786 km above Earth. A single satellite can view approximately 1/3 of Earth´s surface. They travel in the same direction and speed as Earths´s rotation so they appear “stationary” and Earth station do not need to track the satellite.

Medium Earth Orbit (MEO) are located 8,000-20,000 Km above Earth. Typically, they have an elliptical (oval-shaped) orbit, but some travel in near perfect circles. The orbital period is anywhere from 2 to 12 hours. The most common use for satellites in this region is for navigation, communication, and geodetic/space environment science. They are used by GPS satellites. Communications satellites that cover the North and South Pole use MEO satellites.
Low Earth Orbit (LEO) are located 500-2,000 Km above Earth. LEOs are much closer to earth and travel at high speed to avoid being pulled out of orbit by Earth’s gravity. They orbit Earth about every 90 minutes. The international space station is a LEO.
What is Installed on the Ground?
All communications with a geostationary satellite requires the use of Earth stations. They may be fixed or mobile, from small to very large antennas.
The Earth station typically consists of an antenna, RF (radio frequency) equipment to Transmit&Receive, indoor unit and the final communications devices. Final communications devices could be local or off site via terrestrial network.
A teleport or super hub is essentially a large version of a typical Earth station. Teleports have similar equipment to a remotes but the equipment will be hub centric since it is looking at many remotes, rather than the remote just looking at the hub.

As well teleports will also have extra reliability by means of backup power, redundancy of equipment, and sometimes the ability to counteract the effects of fading (uplink power control).
Types of Satellite Services
There are several defined types of satellite service.
Fixed Satellites Services (FSS), so-called because the terminals on the ground are in fixed locations

Mobile Satellite Services (MSS) , where the terminals can be fixed, or in motion such as on a vehicle, a ship or even an airplane.
The worldwide market for fixed satellite services (FSS) is now over $10 billion annually and is significantly larger than the worldwide market for mobile satellite services (MSS).
Historically, Fixed systems have higher throughput and lower operating costs than Mobile systems as a rule. But Fixed Satellite Services (FSS) hardware is more expensive and features larger antennas. They are often susceptible to damage from sand, snow or rain.
Mobile systems have smaller antennas, lower hardware costs and broader coverage. But the cost per minute of use is much higher than Fixed systems, and the throughput rates are far lower than those for Fixed systems.
Demand for both FSS and MSS is growing rapidly and the distinction between the two is becoming blurred as fixed antennas get smaller and mobile terminals accommodate higher throughput speeds.
A third class is “broadcast satellite service” (BSS). Signals are transmitted or retransmitted by space stations are intented for direct reception by the general public. Subscribers receive signals directly from geostationary satellites. Signals are broadcast in digital format at microwave frequencies.
A subscriber needs an installation of a dish antenna, a conventional TV set, a signal converter placed next to the TV set, and a length of coaxial cable between the dish and the converter.
The dish intercepts microwave signals directly from the satellite. The converter produces output that can be viewed on the TV receiver.
What is a Backhaul?
A backhaul (or local loop) is the intermediate link between a core network (teleport or hub) to smaller networks or devices at the edge of the network. It is the physical link or circuit that connects the customers premises to an Earth station.


A backhaul is usually more cost-effective than a customer having their own hub or teleport.
Fading
Satellite Services are subject to fading.
The higher the frequency the more the signal may be affected. C Band is less affected than Ku. Ku is less affected than Ka.
Fading can severely affect service when heavy rain or snow is present.
Tolerances are built into the power levels of the transmitted services to minimize the effect. These tolerances are referred to as fade margins.
That means we transmit more power than what is needed during clear sky conditions and the amount of this power is determined by the link budget analysis.
System design will include a margin to accommodate some signal reduction by precipitation. How much fade margin is used will be determined by the customer’s service availability requirements.
Even with fade margin there still will be some instances where the density of clouds and rain reduces the signal enough that it affects data with errors, or a voice call gets noisy, or it affects a TV channel.