TGS-Nopec
is a norwegian geophysical company which provides of marine seismic data for
E&P companies. The firm could be classified as a commodity company as oil
price impact not only in revenues and earnings but also reinvestment and
financing costs.
Valuation
When
valuing this type of companies, the danger of focusing on the most recent
fiscal year is that the resulting valuation will depend in great part on where we
are in the cycle (oil price). If the most recent year was a boom (or down)
year, the value will be high (or low). Consequently, normalization with
commodity companies has to be built around a normalized commodity price.
So, what is
a normalized price for oil? We will use expected oil prices from the forward and
futures markets. We know that these forward and futures prices only offer the
illusion of forecasts, because they are tied to the current oil price. The
advantage of this approach is that it comes with a built-in mechanism for
hedging against oil price risk. An investor who believes that a company is
undervalued but is shaky on what will happen to oil prices in the future can
buy stock in the company and sell oil price futures to protect herself against
adverse price movements.
Figure 1
shows TGS´s EBIT as a function of the oil price (Real Brent ($/barrel)) each
year from 2002 to 2018.

The
EBIT clearly increases (or decreases) as the Brent increases (or decreases). We
regress the EBIT against the Brent over the period and obtain the following:

To get from
EBIT to equity value at TGS, we make the following assumptions:
- TGS´s EBIT will grow at 2% in perpetuity from next year.
- We estimate a bottom-up beta of 1.08 for TGS. Then we use the treasury bond rate of 2.61% and an equity risk premium of 6.63% to estimate a cost of equity:
Cost of Equity = 2.61% + 1.08 (6.63%) = 9.79%
- TGS has a market value of debt of $55.27 million (after operating lease adjustment) and a market value of equity of $2,769.89 million, resulting in a debt ratio of 98%. Its cost of debt is expected to be 8.72%, reflecting a default spread of 6.11% over the risk free rate. Using a marginal tax rate of 23% (rather than the effective tax rate), we estimate a cost of capital of 9.73% for the firm:
Cost of Capital = 9.79% (0.98) + 6.72% (0.02) =
9.73%
- TGS will continue forever with same ROIC and cost of capital currently estimated in the base year.
TGS
reported EBIT of $230.0 million in 2018, but that reflects the fact that the
average oil price during the year was $70.94. Actually, the expected oil price (future
Brent) has dropped to $66.86, and the EBIT for the coming year should be lower.
Using the regression results, the expected EBIT at this oil price is $172.42:
EBIT (Normilized) = -92.08 + 3.956 ($66.86) =
$172.42
This EBIT has
to be adjusted to operating leases reported in 2018, resulting $170.95 million.
This EBIT translate into a ROIC of 12.54% and a reinvestment rate of 15.94%,
based on a 2% growth rate.
Reinvestment Rate = g/ROIC = 2%/12.54% = 15.94%

Adding the
current cash balance ($273.53 million), subtracting debt with the operating
lease adjustment ($53.90 million), subtracting the value of options ($6.44
million), and dividing by the number of shares diluted (102.3 million) yields
the value per share of:
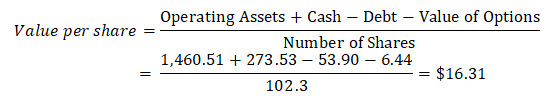
At its
current stock price of $27.79, the stock looks highly overvalued.
Simulation
Because the
earnings, cash flow, and value of TGS are determined to a great extent by what
happens to the oil prices, probabilistic approach could works here. We can use
simulations of the oil price to derive the value of TGS. The trickiest part of
this simulation is to establish how the inputs to the valuation (earnings,
reinvestment, and cost of financing) will change as the price of the oil
change.
We will
make several steps:
1. Determine the probability
distribution for the oil price: Because the value per share is so dependent on the oil price, it would
make more sense to allow the oil price to vary and value the company as a
function of this price

2. Link
EBIT to oil price: We
used the regression results from earlier

3. Estimate the value as a function of EBIT: As the EBIT changes, there two levels at which the
value of the firm is affected. The first is that lower EBIT, other things
remaining equal, lowers the base FCFF, and reduces value. The second is that
ROIC is recomputed, holding the capital invested fixed, as the EBIT changes. As
EBIT declines, the ROIC drops and the firm will have to reinvest more to
sustain the stable growth rate of 2%. While we could also have allowed the cost
of capital and the growth rate to vary, we feel comfortable with both numbers
and have left them fixed.
4. Develop a distribution for the
value: We ran
10,000 simulations, letting the oil price vary and valuing the equity value per
share in each simulation. The results are summarized in Figure 2:

The average
value per share across the simulation was $12.80, with a minimum value of $0,46
and a maximum value of $41,27. The current stock price is $27,79 and there is
96% chance that the value will be less.
Conclusion
Commodity
companies are hard to value because the uncertainty and volatility are, at
least for me, greater than in any other type of companies.
As many
investors try to make pricing (multiples) with TGS-Nopec that probably yield an
undervalued company, my faith in valuing (discount cash flows) is stronger than
pricing and
I would not buy shares in a firm overvalued.
Knowing
that this is a firm with great advantages that we have not analyzed in this post,
I would be patience and wait until the opportunity arises.